Exam #3
(20 points)
- Create a Microsoft PowerPoint presentation that includes
"animated" versions of two of the following three charts.
Similar to
Assignment 27, the various elements of both charts should independently animate (e.g., the various elements of the chart should "Fly In", "Grow Shrink", "Grow & Turn", etc.).
Recommendation: Complete Assignment 24-27 before starting this exam.
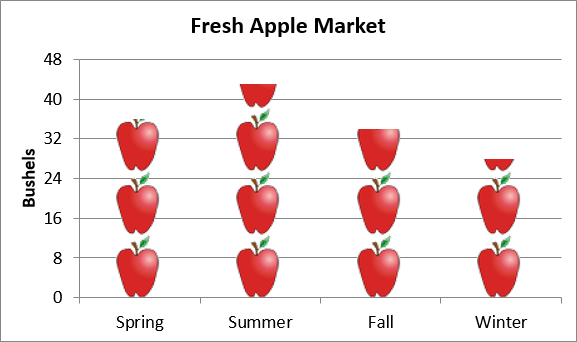
- Chart 1 - "Fresh Apple Market".
Use any fruit other than an apple. For full credit,
your fruit must be tiled or STACKed (not STRETCHed).
-

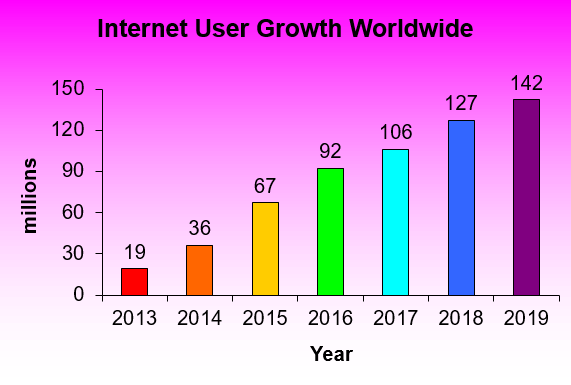
- Chart 2 - "Internet User Growth Worldwide".
- Add the titles "millions" and "Internet User Growth Worldwide"
- Change the scale on the Y axis (to increments of 30)
- Add data labels above the points
- Change the color on the points (rectangles)
- Remove all legends
- Remove all gridlines
- Insert a gradient fill from pink to white

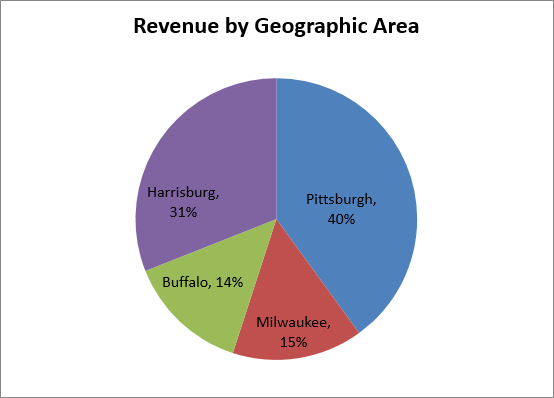
- Chart 3 - "Revenue by Geographic Area".
Enter different city names.

- Include your name somewhere in your PowerPoint Presentation.
- Save your work as "exam3.pptx" when you are finished.
- Upload this file to YOUR-CLASS-WEBSITE.
Help
|


